Sunday, December 21, 2014

Is Oil a Financial Thing?

In The Prize, Daniel Yergin laid out the argument that volatility (not high prices) of oil in the early 1980s was caused by financial speculation.  The primary means of speculation was through derivatives.  The NYMEX had then recently introduced future contracts and, according to Yergin, the story goes that guys like T. Boone Pickens made a small fortune off playing the volatility.

T. Boone had dabbled in cattle and cattle feed and so was well versed in futures trading.  Flash forward 30-something years and we see a parabolic drop in oil prices.  It is a straight line, so to speak, and reads more like a panic riddled sell-off (drop in demand) than a supply driven increase.

Commentary from Charles Hugh Smith's blog:
Crowded trades (trades where almost everyone is on one side of the boat) unwind in precisely this sort of freefall. Once the trade has been unwound, however, the selling cascade exhausts itself and insiders who know better start buying. Buying begets buying, shorts start covering, and voila, a retrace that fills open gaps and kisses the 50-day moving average surprises everyone who was confident oil was heading straight down to $40/barrel. 
As I said before, the monetary base stops expanding and the Fed ends QE, all as oil prices begin their plunge.  Still think the Fed will raise interest rates this coming summer?  Does the Fed take the punch bowl away when the party is just getting started?

More Pipeline Politics

In case you didn't have a FT subscription (don't ask why I have one):


Russia produces about as much natural gas as the US, which is about 6 times the amount Saudi Arabia produces. I recall, as a sophomore in college, reading The Prize and setting the book down to give thought to the fact that the majority of the world's oil and gas resources had been discovered before my father was born (1953). So, just how political is energy?

Tuesday, December 16, 2014

The Chart I Never Saw Coming

Need more time to figure this one out, but it does look very, very interesting.


Saturday, December 13, 2014

Out of Oil, Into Treasuries

Where is the safe place for yield?  Prior to the big drop in oil prices, it was just there - oil.  After a 40% drop in prices over the past few months, investors need to look elsewhere.  And what timing for them to go into US treasuries, if they so choose, as the Federal Reserves exits its third installment of Quantitative Easing and the stock markets begin to dip on weaker than expected consumer numbers.

Ladies and gentlemen, the Fed has left the building.

Thursday, December 11, 2014

Where Does That Capex Go?

Reuters report, link via CNBC, with a headline saying that E&P spending could drop by as much as $150 billion in 2015.  That is a lot of money.  So who makes all this stuff for the oil and gas industry?  All the pipes, rigs, pump, computers, compressors, ROVs, etc, where do they all come from?

Certainly oil exporting nations pay for capex to produce oil.  But do Nigeria, Iran, Iraq, Libya, Saudi Arabia, etc produce the equipment they have installed in their fields?  I wonder if countries like Sweden and South Korea won't take a hit from all of this.

Tuesday, December 9, 2014

Why The Drop In Oil Prices? Three Examinations

First: Libya?  Libyan production skyrocketed by over 500,000 barrels per day from June to September of this year.  Reached a peak of about 900,000 barrels per day.  But now?  There seems to be conflicting reports as to what is happening in Libya.  It seems the rebels have taken over oilfields, but production will continue to come on line.  Libyan production was at 900,000 bpd in September but now may be at 500,000.

Second:  Supposedly Saudi Arabia has been offering lower prices for oil in US markets than in Asian markets.  Nigeria, an OPEC member, has seen exports to the US dry up while Libya restarts exports to Europe.  So there are some real reasons Saudi Arabia has to backtrack on its "US shale doesn't concern us" attitude it has promoted the past two years.

Third (put on your tin foil hat): The Federal Reserve (see explanation below)


The monetary base stops expanding, so institutions with bets on rising oil prices begin selling.  Eventually, the Fed announces the end to QE3 and weeks later the Saudis give the death knell with a "we're not finished, yet" response at OPEC.

Wednesday, December 3, 2014

Bring 'Em Out: Rise of the Consumer

So, I do not read Business Insider. Which is why I chose to use one of their headlines as a contrast for my thesis of rising consumer spending.


Black Friday sales plummeted this year, leaving retailers completely stumped.  
After weeks of declining gas prices, many analysts predicted the biggest holiday season ever. Industry groups like the National Retail Federation reasoned that Americans would use their fuel savings on gifts.  
Despite encouraging forecasts, Black Friday weekend sales were down 11%. Cyber Monday sales rose 8%, falling short of many predictions. 
So where are the customers?

Where are the customers at? Where they at?

The Lord Purveyor of Future Obligations, His Royal Roll-Over of Timely Payment,  Fortress of Accountability, Luke The Debtor saith: Buying higher ticket items.

That's just me. Maybe no one else feels that same way. But after 6 years of paying down debt, I wonder if this drop in oil prices is giving people the premature illusion of prosperity. But, the data are not in to show this. Where are the customers? It is time say Luke The Debtor...bring 'em out!


Tuesday, November 18, 2014

Saturday, November 15, 2014

Looking at The Data: Top Three & Next Three Oil Producers

It's cold this weekend. Very cold. The arctic blast, polar vortex, Rossby wave or whatever you want to call it, is acting up. So, I am staying inside.

For all the commotion in the media not geared toward the weather or Ferguson, there has been some attention spent on Saudi Arabia's offer of higher prices for Asian consumers and lower prices for others.  This is all before the G-20 and the OPEC meetings this month.  Maybe the Saudis want to remind everyone who is the alpha dog.

However, the US, the largest consumer is, according to the EIA (biased?), the largest producer of oil.  And its accent to number one has come within the past four years.  This is must be a testament to American ingenuity, low-interest rate induced prices, and the inability to exit (escape) the exurban lifestyle.


Saturday, November 1, 2014

There's a New Dealer at the Table

A weekend post, which means a lot of incoherent ranting and linking to someone else's post and commenting about it here on my blog. Awesome.  So here is Soberlook's post regarding the halt in the Fed's monetary expansion and use of repo deals (reverse repos).

So, despite the end to the (in)famous QE3, the monetary base had already begun to peak.


There is a new dealer at the table - same as the old dealer. Even though the Fed is now reducing its QE purchases to the $15 billion dollar range, it will continue to stoke the markets as the dealer at the  repo table.  Maybe repos are the unconventional policy that the Fed needs.


Analogously, oil production in the US is turning unconventional - drilling sideways and shoving a bunch of sand and water down the hole.  It works.  It works very well.  So why shouldn't repo financing work for the Fed?  Well, some people claim that repo deals are what allowed banks to leverage themselves to the point of utter ruin (i.e. Lehman).

But just because Lehman can't get it right doesn't mean others can't.  I mean, just because BP and ExxonMobil struggle with their onshore tight oil and gas plays doesn't mean other companies will or have to struggle.

Wednesday, October 29, 2014

Standby For Corporate Debt Launch

Just my gut feeling telling me that the US corporate scene has room to grow.  See chart below.


Wednesday, October 8, 2014

Libyan Oil Production: It's Back

Oil prices continue their slow downward descent as supply outpaces demand. One new contributing member to the supply increase is Libya's increased oil production.  My previous note on Libyan oil production noted a decline in production in the 2Q of 2013, though after a halt to production as rebels vied for control of Libya.


Wednesday, October 1, 2014

Eagle Ford: Fracking Revolution Seen in Chart

Unconventional techniques offer orders of magnitude more initial production (IP) than conventional techniques.  Looking at this chart from the EIA, it looks like IP is up by 400 times what it was just a few years ago and more than that before unconventional techniques.


Tuesday, September 23, 2014

The Next Big Shale Formation And The Germans

The Utica is starting to blow up.  The last I checked, the rig count was below 50 but with Aubrey McClendon's new company, American Energy Group, looks like they are going all in on the Utica.  Other companies appear to be planning for large operations in the area such as Eclipse and Hess.  The Utica, along with the Niobrara, could be the next wave in oil investment booms in the US.

http://www.eia.gov/todayinenergy/detail.cfm?id=17511
Also, Siemens, the German rival/equivalent of General Electric, has agreed to purchase US pumping specialist Dresser-Rand.  The move should give the German company a foot in the door in the US onshore shale boom.  This is perhaps both a politically and technologically strategic move.  It gives Germany room to operate away from Russian gas in the future, may allow Germany to reduce its dependence on coal, and open the Germany economy to modern oil and gas technology.

Tuesday, September 16, 2014

American Diet: Chinese Edition

I've heard that American fast food is catching on like wildfire in China.  The Chinese may becoming more obese and diabitic as a result (just like their 'Murican counterparts).  From Adam Minter:

China is now home to a quarter of the world's diabetes sufferers. That amounts to more than 100 million people -- nearly 12 percent of the population. And according to The Lancet Diabetes & Endocrinology, the British medical journal which last week published a three-part series on Chinese diabetes, the patient pool is almost certain to expand dramatically. More than 600 million Chinese suffer from prediabetes, a condition in which individuals exhibit elevated blood sugar levels that can spark Type 2 diabetes if not treated. 
These are epidemic conditions, and China is going to have an even harder time getting its crisis under control than the U.S. (where 9.6 percent of the population suffers from diabetes) and other developed nations. Genetic and other biological factors make Chinese "particularly susceptible" to Type 2 diabetes, the Lancet study's authors write. And the country's healthcare system, already struggling to provide affordable access to hundreds of millions of uninsured rural residents, isn’t anywhere near ready to care for tens of millions of chronic disease sufferers. Diabetes treatment in China currently focuses on managing complications and end-of-life care. According to some estimates, the disease could consume more than half of China's health-care spending if all patients were to receive routine, state-funded care. 
Indeed, diabetes has the potential to cause the kinds of social and economic upheaval more commonly associated with infectious diseases. “In a country that has gone from economic strength to strength,” the Lancet writes in an editorial accompanying the series, "the diabetes epidemic can now be viewed as a measureable hurdle to achievement of further growth and stability.”

Friday, August 29, 2014

Blame it on Rio (and the World Cup)

From the FT:
“We believe that this contraction is largely a temporary effect caused by the reduction of business days during the World Cup,” Itaú-Unibanco said in a research report.
I was under the assumption that building new sports stadiums boost an economy.

Thursday, August 21, 2014

If I Were A Central Banker, This Would Be My Number One Graph

Bottom?


I am still bullish on consumer spending.  Just too many cool gizmos out there, extended adolescence of millennials, and retirement of baby boomers.  Money is a state of mind.  As long as the right mindset exists - desire, motivation and commitment - there will be lots of money to spend.

Saturday, July 19, 2014

Money Supply: China:US

I played around with some of the Chinese and US money supply data.  I didn't occur to me that Chinese money supply is so large, but then again it is a large economy with very large upside potential.  Notice that the M1 ratio has gone flat but M2 and M3 ratios are still moving upward.

Graph #1: M1 China:US


Graph #2: M2 China:US


Graph #3: M3 China:US

Thursday, June 19, 2014

NY Fed back in the game

Repos are back, and in a big way.  The NY Fed is taking over the game, though I wonder if they didn't take over the game initially during the financial crisis.  From the FT:
The Federal Reserve Bank of New York has emerged as the single largest player in an important segment of the short-term lending market that was at the epicentre of the financial crisis. 
The Fed’s decision to quadruple its trading with government money market funds in the repurchase or “repo market” is a sign that the central bank is now engaging more directly with the shadow banking system at the expense of large Wall Street banks. 
Historically, the repo market was where big banks pawned out their securities such as Treasury bonds to lenders including money market funds, insurers and mutual funds, in exchange for short-term financing. Now the Fed is stepping in to trade as well as it prepares to end its current near-zero interest rate policy. 
Armed with a balance sheet of $4.3tn of bonds purchased during quantitative easing, the Fed is using what it calls its reverse repo programme, or RRP, to trade with money funds at a time when tough new regulatory standards have made such borrowing less attractive for the banks.
Like the article says, the Fed is now becoming a dealer of last resort.  I am not sure if I want to visit that casino much less be dealt any cards.

Dealer of last resort

Wednesday, May 14, 2014

Is Now The Time For Oil Exports?

Texas


Forget about the Keystone XL Pipeline, the biggest issue facing the US upstream oil industry may be the congressional oil export ban.  As 
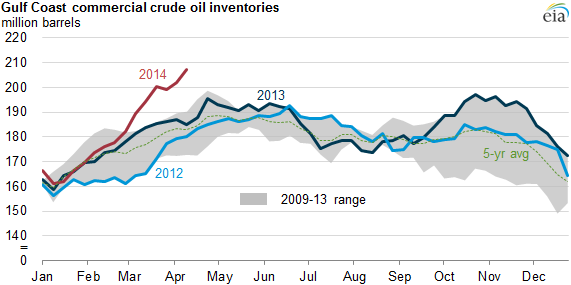
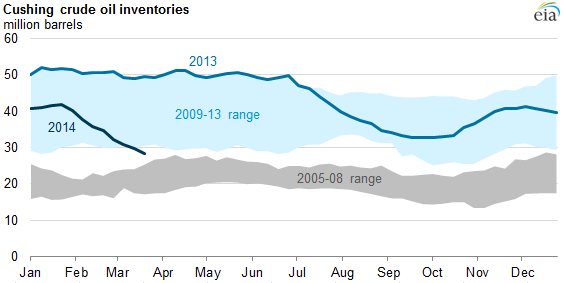
previously discussed, Light Louisiana Sweet (LLS) was trading below West Texas Intermediate (WTI) due to a large increase in Gulf Coast inventories - TransCanada's Market Link pipeline is projected to fill to capacity sometime this summer.  Rooted in both the 1920's Jones Act (maritime law) and the 1970's oil crisis, the current oil export restrictions mean that companies may export some refined products and export oil to the US East Coast and Canada (Jones Act).  Potential downward pressure on the price of light oils may be alleviated by a congressional lifting of the oil export ban.

Map 1 (Source: RBN Energy)
Beginning this summer, a significant build-up of export (takeaway) capacity will take place in the Permian Basin of west Texas and southeast New Mexico (1, 2).  By the end of 2015, nearly 850,000 barrels per day of capacity, in the form of new pipelines and upgrades, will have been added to the basin's transportation infrastructure.  The Gulf Coast refining market which will receive the overwhelming majority of this new capacity are engineered to process heavier oils (i.e., Saudi and Venezuelan) rather than the light oils and condensates (usually 45+ API) produced in the US's ultra-tight oil plays (i.e., Eagle Ford and Cline).

This presents a challenge to the operators in these light oil and condensate plays.  With a lack of capable domestic refining capacity for their product and an increase in both production and inventories, price spreads will likely make export an attractive possibility.  However, there are many barriers to exporting oil, besides determining logistics and finding markets.

Graph 1 (Source: RBN Energy)
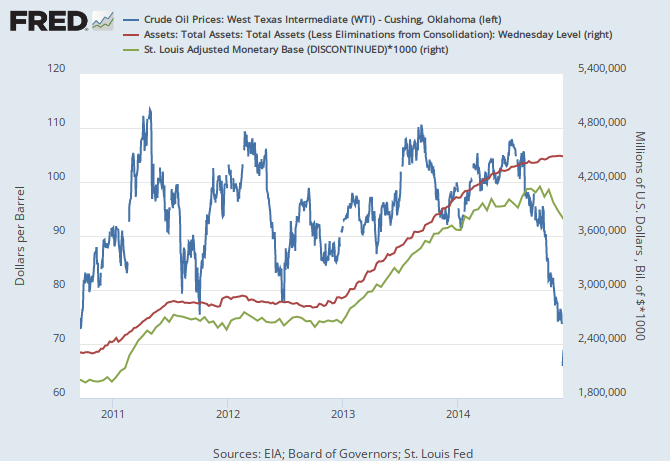
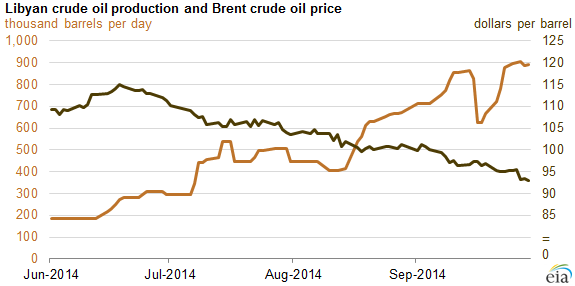
In the late 1970's, the congress sought to restrict oil exports as a means to alleviate fears of domestic oil shortages and price shocks.  While the US does export oil in the form of refined products, current environmental restrictions prohibit the construction of new refineries.  The build up in inventory due to the lack of capable demand appears to be preventing domestic oil from appreciating to the same level as other benchmarks, such as Brent.

...and the Williston Basin...and Canada


The Keystone XL Pipeline, under environmental review by the Obama administration, may pose another challenge to domestic oil producers.  The expansion of the Keystone pipeline will largely bypass the heart of the Williston Basin - traversing through the southern margin of the basin where the Bakken has pinched out.  The State Department's most recent executive summary of the Keystone XL Pipeline indicates that 730,000 of the 830,000 barrels per day of capacity are designated for Western Canadian Sedimentary Basin oils (tar sands).  Up to 100,000 barrels per day have been set aside for US oils, but operators have so far been able to only make just 65,000 barrels per day of promises (or commitments) toward the pipeline.

Map 2 (Source: Enbridge)
The Permian and Keystone XL pipelines are not the only projects putting potential downward pressure on oil prices.  Parts of the Williston Basin are serviced by pipelines that run south, from Montana and North Dakota to Guernsey, Wyoming.  This system is also undergoing significant pipeline expansion in the Rockies.  The Pony Express, a former gas pipeline undergoing conversion to oil, will increase takeaway capacity by up to 240,000 barrels per day.  Also, Enbridge's two projects - the Sandpiper pipeline and the Line 9B reversal - will also alleviate congestion for Williston Basin producers.

By Rail and Barge


There is one catch to the Jones Act and other congressional oil export bans - some oil may be exported to Canada.  This has lead to an expansion in rail shipments to Canada and the US East Coast.  While oil shipment by rail has come under increased scrutiny (1, 2) due to some very tragic accidents (1, 2), it looks like it will remain a pillar of takeaway capcity for the Williston Basin.
Photo 1 - Barge loading facility somewhere
 near the Houston Ship Channel (Source: Google)

Barge operators have been beneficiaries of the oil-by-rail movement (and due to overstocked Gulf Coast inventories).  While many Gulf Coast refineries have train-accessible off-loading facilities (for refined products), they do not have sufficient train-accessible unloading facilities to handle the increase in oil production.  However, many rail lines terminate near waterways.  Oil shipments by rail can be offloaded from trains and onto barges.  The barges (30,000+ barrels) can then sent to the refineries where barge access can accommodate the greater volumes of oil.  Barge operators will stand to benefit from any Jones Act shipments to Canada, as well as shipments to the US East Coast.

The crude wall


In the next two years, significant upgrades to US liquid hydrocarbon pipeline infrastructure will likely change the trajectory of 
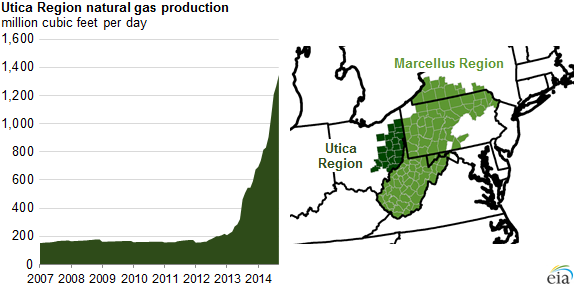
government and American attitudes toward oil exports.  Even ethane, produced in dry gas basins along with methane, may develop an export market to European and Asian buyers due to a US supply gut.

The crude wall may be coming.  With the increase in takeaway capacity, operators' ability to expand their production may lead to the US becoming the world's largest oil producer in a few years.  Today, both Russia and Saudi Arabia vie at times for the title of both largest producer and exporter of oil.  The resulting increase in production will likely continue to decrease US imports, reshape the trade deficit and change US-international politics.

Tuesday, April 22, 2014

Gulf Coast Crude Inventory Record

From the EIA:
Crude oil inventories on the U.S. Gulf Coast (USGC) reached 207.2 million barrels (bbl) on April 11, a record high. The elevated inventory levels are the result of the continuing strong crude oil production growth, the opening of TransCanada's Marketlink Pipeline, and a drop in crude oil inputs at USGC refineries as a result of seasonal maintenance.
...
The main driver of the recent crude oil inventory builds on the USGC is start-up of TransCanada's 700,000-bbl-per-day (bbl/d) Marketlink Pipeline, which runs from the Cushing, Oklahoma storage hub to the Houston area. In late January, TransCanada completed the first delivery of crude oil via Marketlink to USGC refineries. Trade press has reported that crude oil deliveries via Marketlink are expected to average 525,000 bbl/d in 2014. The pipeline start-up has been a main driver of recent corresponding draws at Cushing.
Graph 1

Meanwhile, at Cushing:
Crude oil inventories at Cushing, Oklahoma, the primary crude oil storage location in the United States, decreased 13 million barrels (32%) over the past two months. On March 21, Cushing inventories were less than 29 million barrels, more than 20 million barrels lower than a year ago and the lowest level since early 2012. Cushing is the delivery location for the New York Mercantile Exchange (Nymex) West Texas Intermediate (WTI) crude oil futures contract.
The recent drawdown of stocks at Cushing resulted from three factors:
  • The startup of TransCanada's Cushing Marketlink pipeline, which is now moving crude oil from Cushing to the U.S. Gulf Coast
  • Sustained high crude oil runs at refineries in Petroleum Administration for Defense Districts (PADD) 2 (Midwest) and 3 (Gulf Coast), which are partially supplied from Cushing
  • Expanded pipeline infrastructure and railroad shipments that have made it possible for crude oil to bypass Cushing storage and move directly to refining centers in PADDs 1 (East Coast), 3 (Gulf Coast), and 5 (West Coast)

Graph 2

This is leading to a discount in Light Louisiana Sweet (LLS) (the Gulf Coast benchmark) to West Texas Intermediate (WTI) (the US benchmark).  WTI is already trading at a discount to Brent (sort of the world/European benchmark) and the TransCanada pipeline may cause further discount in LLS.
Graph 3

Sunday, April 13, 2014

Another Spectre For Rising Consumer Spending

Delinquency rates on consumer and credit card loans are at 20+ year lows.
Graph 1

Charge-off rates are at 15 and 20 year lows.
Graph 2

Looking at cars, 48-month financing looks like it is supercheap by recent historical comparison, and the inventory to sales ratio is moving upward (suggesting favorable conditions for consumers).  The housing market still looks tight.  This could mean that people (especially young persons and young couples) will look toward car purchases as a way to substitute the American dream.  Also, appears to be a trend in leasing autos.
Graph 3

The market seems to have changed since the recession, and why not?  Fiat acquired Chrysler in the wake of the recession, and Chevrolet required a massive loan from the federal government to prevent liquidation bankruptcy.  These kinds of corrections may have helped correct the flawed thinking of those and other automakers.
Graph 4

Wednesday, April 9, 2014

Value Invest Much?

Two charts I made to capture the EV/EBITDA (Enterprise value to Earnings ratio) of the US stock market and US economy, as closely as possible.

First: The stock market

A = Nonfinancial Corporate Equities
B = Nonfinancial Corporate Debt
C = Nonfinancial Corporate Savings
D = Corporate Profits

(A + B - C) / (D)
-or-
[(Nonfinancial Corporate Equities) + (Nonfinancial Corporate Debt) - (Nonfinancial Corporate Savings)] / [(Corporate Profits)]
Graph 1

Second: The whole US economy

A = Nonfinancial Corporate Equities
B = Homeowner's Equity
C = Total Credit Market Debt
D = Total Saving
E = GDP
F = Federal Taxes
G = State and Local Taxes

(A + B + C - D ) / (E - F - G)
-or-
[(Nonfinancial Corporate Equities) + (Homeowner's Equity) + (Total Credit Market Debt) - (Total Saving)] / [(GDP)-(Federal Taxes)-(State and Local Taxes)]
Graph 2

Now, it would be nice if the data extended further back, and obviously we need some comparisons to their peers.  However, that will have to wait.

Tuesday, April 8, 2014

Is US Consumer Spending About to Take-Off

I decided to look into the matter of housing starts hitting a recent plateau.  What I think stands out most in the following graph is a kind of out-of-phase correlation between household financial obligations and housing starts.  Though certainly the correlation makes sense!
Graph 1
It almost looks as if I could take the red line (housing starts) and shift it over to the right just a little bit, and then the two would line up almost perfectly.  In fact, I loaded the data into Excel, moved the (quarterly) data over by 10 quarters (2.5 years -or- 30 months), and I produced the following graph.
Graph 2
Pretty neat, huh?  Now, is this any sort of indicator of consumer spending?  First, I should let you know that financial obligations refers to mortgages, rent, auto-loans, homeowner's insurance, property tax and that sort of thing.  That should mean that financial obligations follow housing availability trends, as well as auto availability trends.  But should consumer spending follow the trend in mortgage and rent payments?

Why not?  First, why so?  If you believe in the wealth effect - people get a little richer (produce more) and spend a little more (consume more) - then you might say that consumer spending will have some correlation with housing trends.  As people buy houses, they also buy appliances, furniture, cheap plastic stuff, hardwood floors and so on.  Some of these would be examples of durable goods.  I think there is strong correlation between durable goods and housing starts, so let's see the trend.

Durable goods are only part of personal consumption.  I think the housing market is just as fragmented now as it was in 2005-2006 when places like Los Angeles, Las Vegas, Miami, and Phoenix were experiencing phenomenal housing price gains.  The hotspots in today's market, to me, appear to bee Dallas, Houston, San Fransisco and Los Angeles.

Spurred by big investments in the oil and gas industry as well as the "new tech", many of these markets are experiencing price growth much higher than the national average.  It will be interesting how things play out over the coming years since the top brass in the oil industry got together and declared $100 oil to be the new $20 oil.

Sunday, April 6, 2014

Is This Real: Venezuela Government Issues Food Ration Card

Tough times for the South American citizens of Venezuela.  Hit by shortages in toilet paper, foreign currency, and oil production, the Venezuelan government is now expected to issue food rationing cards.  From the Guardian:
The ID card, introduced this week, will limit Venezuelans to once-a-week shopping and will set off an alarm to halt any transaction if a purchaser breaks the rules. The government wants to prevent individual shoppers from "over-buying" in a country hit by acute shortages of basic items including milk, sugar and toilet paper. Critics say it is an admission of failure of economic policy in one of the world's big oil-producing nations. 
"The government needs to control the hoarders. They have made this worse. But if there weren't shortages there wouldn't be hoarders. We are trapped," says Jose Diaz, a 65-year-old construction worker.
The last time the Venezuelan government dealt with hoarding, it seized control of a electronic stores in Caracas and discounted prices to fire sale levels.  So much for being trapped.
According to the food minister, Félix Osorio, registering for the card will not be mandatory and regular users may still shop at the network of subsidised food chains. But as with many customer loyalty programmes, cardholders will benefit from even lower prices, extra offers and even enter a raffle to win one of 500 houses in Venezuela's largest public housing programme.

Friday, April 4, 2014

Brazil Raises Key Interest Rate

Brazil continues its trend of monetary discipline with another raise in the key Selic interest rate.  From Reuters:
Although another rate hike in May has not been ruled out, the statement signaled that the bank would be very sensitive to upcoming economic and inflation indicators to decide whether to continue raising borrowing costs or end the cycle. 
Many analysts have said the bank could very well end the tightening cycle in May to avoid hampering the growth of an economy that has been stuck in a rut for the last three years. 
... 
Another inflation bout caused by a rise in food prices as a severe drought hit crops in southeastern Brazil has threatened to push inflation above the ceiling of the official target range of between 2.5 and 6.5 percent.

Friday, March 28, 2014

China Housing Bubble Blues

At least for one Chinese real estate developer, Zhejiang Xingrun Real Estate, the party is over.  I'm not sure what to make of the company's demise but I think this might be a bigger issue than the Chaori bankruptcy.  The Chinese real-estate market is surely larger than the solar energy market, with greater asset values and greater liabilities.  From the Sydney Morning Herald:
A Chinese real estate developer with more than half a billion dollars in debt has collapsed and its largest shareholder detained in what could be a further sign of financial stress in the world's second largest economy. 
The Zhejiang Xingrun Real Estate Co, which is based in wealthier eastern China, did not have sufficient cash to repay 3.5 billion yuan ($625 million) of debt to creditors, including more than 15 banks, Chinese officials reportedly told local and international media. 
The collapse of the company, based in the eastern town of Fenghua, has put investors on edge as it adds to concern of strains in the nation's real estate sector and comes less than two weeks after the first bond default by a Chinese company.

Wednesday, March 26, 2014

Oil Industry Austerity

Despite a projected record year for capex spending in 2014, oil majors are doing their best to reign in their spending (see ExxonMobil for a specific case).  This fiscal restraint will likely hit off-shore rig manufacturers who have no-contract new builds, service companies, and the employees of the various respective oil companies.

Non-majors have been experiencing the pinch from rising labor and completions costs.  EnCana late last year announced a 20% reductions in its workforce; UK firm BG Group may be reducing its workforce by more than 5%; Chesapeake late last year announced that the punch bowl would be taken away under new CEO Doug Lawler.

The money quote came at IHS CERAWeek 2014 from Chevron's CEO, John Watson:
$100 oil is becoming the new $20 oil.

China: Top Net Oil and Petroleum Products Importer

From the EIA:
In September 2013, China's net imports of petroleum and other liquids exceeded those of the United States on a monthly basis, making it the largest net importer of crude oil and other liquids in the world. The rise in China's net imports of petroleum and other liquids is driven by steady economic growth, with rapidly rising Chinese petroleum demand outpacing production growth.

Thursday, March 20, 2014

Buy, Sell and Trade: Repo

The Federal Reserve tapering has included a substantial increase in reverse repo activity.  The Fede really needs the cash, right?

Reverse repos held by the Federal Reserve.


Reverse repurchase agreements are transactions in which securities are sold to primary dealers or foreign central banks under an agreement to buy them back from the same party on a specified date at the same price plus interest. Reverse repurchase agreements absorb reserve balances from the banking system for the length of the agreement. They are typically collateralized using Treasury bills. As with repurchase agreements, the naming convention used here reflects the transaction from the dealers' perspective; the Federal Reserve receives cash in a reverse repurchase agreement and provides collateral to the dealers.

Ticker-Taper Parade

For the third time in four months, the Federal Reserve has trimmed $10 billion in asset purchases: 12/18/14, 1/29/14, and 3/19/14.  And here is the rise in short-term interest rate:

1-year treasury (blue) and the Fed Funds (red) rate.

Percent change from year ago in Federal Reserve holdings.

Tuesday, March 18, 2014

2014 Global Oil Exploration and Production Spending

Global oil exploration and production (E&P) spending is expected to reach $723 billion in 2014, according a Barclays report published in December 2013.  Putting the 2013 number ($682 billion)  in perspective of gross world product (GWP) means it would have accounted for 0.95% of gross world product (CIA data) for 2013.

Taking it one step further, using the IMF's estimated 2014 GWP growth rate of 3.7%, the estimated $723 billion in spending would account for 0.97% of 2014's GWP.  The quick and dirty method may not be the best way to come to such a conclusion.


Friday, March 14, 2014

China: Iron and Coal

From Bloomberg:
Iron ore extended its decline into a bear market, slumping by the most since August 2009, amid concern that demand in China is slowing just as rising output signals a global glut. 
Ore with 62 percent content delivered to Tianjin fell 8.3 percent to $104.70 a dry ton, the lowest since October 2012 and the biggest drop in more than four years, according to data from The Steel Index Ltd. yesterday. The benchmark price lost 27 percent since Aug. 14, when it reached a five-month high of $142.80. The raw material dropped into a bear market on March 7. 
BHP Billiton Ltd. (BHP) and Rio Tinto Group predict lower prices this year after producers in Australia and Brazil spent billions of dollars to expand output. Banks from Citigroup Inc. to UBS AG predict a global surplus, and Goldman Sachs Group Inc. listed iron ore among its least-preferred commodities for 2014. A surge in stockpiles at China’s ports spurred speculation that the inventory overhang threatens imports.
The Chinese Yuan to the US Dollar:


The council represents the largest, primarily state-owned power generators, and Liu issued his warning at the annual Coaltrans China conference. 
Competition from clean energy, including hydro, nuclear, wind, solar and biomass power, will keep the annual growth of coal-fired power - and thus demand for coal - well below 5 per cent in the coming decade, compared to 11 per cent in the previous one, he said. 
"In the next three to five years, power-station coal demand will be weak. The years of long-term tight coal supply will not reappear," he said. "We will have a structural over-supply of coal-fired power. The main driver for coal demand and price will no longer be total power demand, but rather natural gas development policy and rainfall patterns for hydro power."
Coal will still be largest energy source in China for the remaining decade and will also be a dominant driver of energy production elsewhere in the world.  However, natural gas projects in Central Asia will provide China with the first steps in achieving clean energy production.  And there is a 9,000 km pipeline to bring it to residents of Hong Kong:
The project cost 142 billion yuan (HK$178.8 billion) and is operated by the China National Petroleum Corporation. From this summer, it will provide a new source of gas to Hong Kong, replacing the supply the city has been drawing from Yacheng near Hainan Island since 1996 and which is now nearly exhausted. Work on the gigantic project began in 2008. A little over three years later, the main trunk went into operation across the mainland and in August last year the Guangzhou to Shenzhen stretch went live. Now, after a huge engineering effort, Hong Kong is about to join the network.

Thursday, March 13, 2014

Chinese Refinery Overcapacity

South China Post has an article about capital spending cutbacks by China's two largest oil majors - PetroChina and Sinopec.  Cutbacks are attributed to apparent overcapacity in the refining and midstream sectors.  From the SCMP:
PetroChina, which leads the world's companies in capital expenditure, and fellow oil and gas producer China Petroleum & Chemical (Sinopec) are expected to trim spending in the next few years. 
Contributing factors are flat oil prices, rising debt, slowing growth in demand and excess capacity in oil refining and chemicals.
According to this Reuters article, 2013 was China's lowest oil demand growth in 22 years - according IEA data.  I found references (from an unnamed source) about three delayed refinery projects in this Reuters article.
"China's oil consumption growth is slowing down and overcapacity in the oil industry is looming. Rapid expansion in refining capacity will result in a glut and increasing net fuel exports," said the PetroChina official who declined to be identified because he is not authorized to talk to media. 
... 
PetroChina will now start up its 200,000-bpd Kunming refinery in the Yunnan province in 2016, two years behind the original schedule, the official said. 
Operation of a 400,000-bpd joint venture refinery in Jieyang of Guangdong province will be delayed to 2017, versus the original plan of 2013, he said.
Shifting to parallels in the other hemisphere, oil majors saw impacts from their own refining overcapacity.  Some majors and independents have begun spinning-off their upstream and downstream units from one another.  Some majors even saw their revenues impacted, from FT:
Squeezed margins in the global refining industry are hurting the world’s largest oil companies, as Royal Dutch Shell, Total and ExxonMobil all blamed poor quarterly earnings on a decline in their downstream businesses. 
Results from Shell were the most disappointing Thursday, as its profit dropped almost a third to $4.5bn. ExxonMobil’s profit fell 18 per cent to $7.87bn, while Total’s declined almost a fifth to €2.72bn. 
All the majors have been hit by refinery overcapacity and weak demand for petrol and diesel in slowing western economies, which has hit earnings in their downstream – refining and marketing – divisions. 
The problem is most striking in Europe, despite refinery closures that have taken some 1.7m barrels a day of capacity out of the system since 2008. Figures from the International Energy Agency show European demand for refined products will average 13.5m b/d, almost 2m b/d less than in 2008.
If China is in a period of oil refining overcapacity, what does that mean for future oil prices?

Friday, March 7, 2014

The First Hydraulically Fractured Horizontal Well

Completed in the North Sea in 1987.  From Schlumberger's Oilfield Review:

By 1986, though, Maersk Oil decided that cementing would work and that it was time to attempt the industry's first horizontal, hydraulically fractured well.
Production rate comparison of horizontal wells (MFBs) to a conventional well.

If All Debts Were Paid At The Current 1-Year Treasury Rate

Less than one percent of GDP.
Unlikely

Thursday, March 6, 2014

Russian Pipeline Politics

I have yet to post anything about the Ukraine.  So I figured I would talk about Russia - the world's largest producer and exporter of oil.  Russia is also the second largest producer and the largest exporter of natural gas.  The following video is five years old, so a little out-dated, but still informative.


Updates to the information in the video:

  • The Nord Stream pipeline has been completed and is delivering natural gas
  • The South Stream is in the construction phase and expected to deliver natural gas by 2015
  • The Nabucco pipeline has been sidelined in favor of the Trans-Adriatic (below)
  • The Tran-Adriatic pipeline has received much support but no construction has taken place
  • The White Stream pipeline has received some fanfare but no construction has taken place
Other significant natural gas exporters to Europe include: Qatar - the world's largest LNG supplier with major exports to South Korea, Japan, Spain and the UK; Norway - a large exporter to UK, Germany, France and other western European nations; Algeria - a major supplier for Italy and Spain; Netherlands - an exporter to the UK, Germany and Belgium.

The YouTube page also had a link to an interesting video about Turkmenistan - a potential supplier of natural gas for various Turkey-crossing pipeline projects.  This video might help represent the nature of Russian pipeline politics.


One event which may give further strength to Russian dominance in the energy markets is Saudi Arabia's increasing rate of oil consumption.  Saudi Arabia consumes about 3 million barrels of oil per day and has a population of about 30 million.  This makes it one of the largest consumers of oil per-capita in the world.

Extrapolate out Saudi Arabia's current oil consumption and production rates over the next 20 years and you just might find that the country will become a net oil importer.  Citigroup in 2012 made such an extrapolation.  From Bloomberg:

“If Saudi Arabian oil consumption grows in line with peak power demand, the country could be a net oil importer by 2030,” Heidy Rehman, an analyst at the bank, wrote. The country already consumes all its natural-gas production and plans to develop nuclear power, which pose execution risk amid a lack of available experts, safety issues and cost overruns, Rehman said.
...
Saudi Arabia’s per capita consumption in 2011 is higher than most industrialized nations, including the U.S., according to the report. The nation’s 10-year historical consumption compound annual growth rate may increase 6 percent, double its projected population growth, Rehman wrote. Saudi Arabia’s population was 28 million as of the end of 2011, International Monetary Fund data compiled by Bloomberg show.
Part of Saudi Arabia's oil consumption goes towards electricity production.  Though the country has plans to replace oil with natural gas, nuclear and solar for electricity production, the rising increase in oil consumption is also coming from transportation fuel demand - gasoline.

Saudi oil consumption (1980-2012)

Tuesday, March 4, 2014

So What Exactly Is Going On In Venezuela?

As part of my political correspondence:

Four Years of NIRP

NIRP - Negative (Real) Interest Rate Policy
From Wikipedia:

A liquidity trap is a situation described in Keynesian economics in which injections of cash into the private banking system by a central bank fail to lower interest rates and hence fail to stimulate economic growth. A liquidity trap is caused when people hoard cash because they expect an adverse event such as deflation, insufficient aggregate demand, or war. Signature characteristics of a liquidity trap are short-term interest rates that are near zero and fluctuations in the monetary base that fail to translate into fluctuations in general price levels.

Thursday, February 27, 2014

More On China's Iron Ore

Rising commodity prices increase the equity of existing commodity stockpiles.  When prices stop rising - not necessarily when they start falling - they may pose credit extension issues for leveraged traders.  Sober Look has an interesting insight into this phenomena:
Moreover, some traders supposedly used the same iron ore and steel inventory with multiple counterparties at the same time (equivalent to taking out multiple mortgages on the same house at once). 
With banks cutting back lending in this sector and the yuan actually declining recently, that gravy train has stopped. Traders are being forced to dump inventory. That is sending prices lower and even pressuring some mills to close.
I'm interested in seeing how the exchange rate with the US dollar goes.

China/US currency trade ratio.

Monday, February 24, 2014

China: Iron Ore

Another Chinese commodity stockpiling story from Bloomberg:

“The risk comes when metal prices fall by a large magnitude within a short time, driving down the value of the collateral,” Yang Changhua, a researcher with Beijing Antaike Information Development Co., said in a Feb. 19 interview. “Borrowers, forced by their bankers to repay loans or to top up collateral, will have to sell the metals, sinking market prices even further and begetting a vicious cycle.”
A vicious cycle, indeed. 

Tuesday, February 11, 2014

PIIGS Unemployment

I've been busy with a new musical instrument, work and personnel life - they have all been colliding, so I hope it does not affect my music.  So, I have not had my usual time to look at the charts, but I have been looking at some of the EU unemployment figures - especially that of the infamous PIIGS.  Conditions have improved in Ireland and Portugal but unfortunately for Italy, Spain and Greece there is not much I can say whether conditions have become better or worse.
PIIGS unemployment since January 2003.  Greek data go to October 2013, all others December 2013.
Being unemployed in Greece has become a full-time job, so it would seem.

Tuesday, January 28, 2014

Libyan Oil Production

The most recent EIA data show declining oil production in Libya.  The EIA estimates about 1.1 million barrels per day of production from Libya in the 2Q of 2013.  This is about 0.8 million barrels less than its peak production in the 1Q of 2008 -- or a 43% decline.

Below is a chart of oil production form Venezuela, Iraq, Egypt and Libya since 2000.  I chose these countries because they have each gone through similar governmental change.  However, only Venezuela (2002), Iraq (2003) and Libya (2011) show major changes in oil production due to coup and war.


The Libyan government wants to resume production at some of its major oil fields where protesters have caused a massive delay in production.  Meanwhile militias want to export oil.  The Libyan government has warned rebel groups that it will take military action in the country's eastern ports if such actions continue.

Similarly in Iraq, the northern government in Kurdistan is shipping oil to Turkey without the explicit permission of the Iraqi national government, so far.  Turkey promises to put the oil in storage until approval is given.  Ok.