First: The stock market
A = Nonfinancial Corporate Equities
B = Nonfinancial Corporate Debt
C = Nonfinancial Corporate Savings
D = Corporate Profits
(A + B - C) / (D)
-or-
[(Nonfinancial Corporate Equities) + (Nonfinancial Corporate Debt) - (Nonfinancial Corporate Savings)] / [(Corporate Profits)]
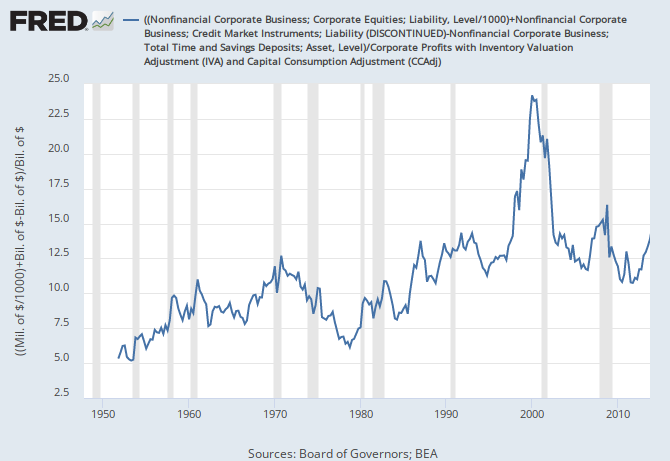 |
| Graph 1 |
Second: The whole US economy
A = Nonfinancial Corporate Equities
B = Homeowner's Equity
C = Total Credit Market Debt
D = Total Saving
E = GDP
F = Federal Taxes
G = State and Local Taxes
(A + B + C - D ) / (E - F - G)
-or-
[(Nonfinancial Corporate Equities) + (Homeowner's Equity) + (Total Credit Market Debt) - (Total Saving)] / [(GDP)-(Federal Taxes)-(State and Local Taxes)]
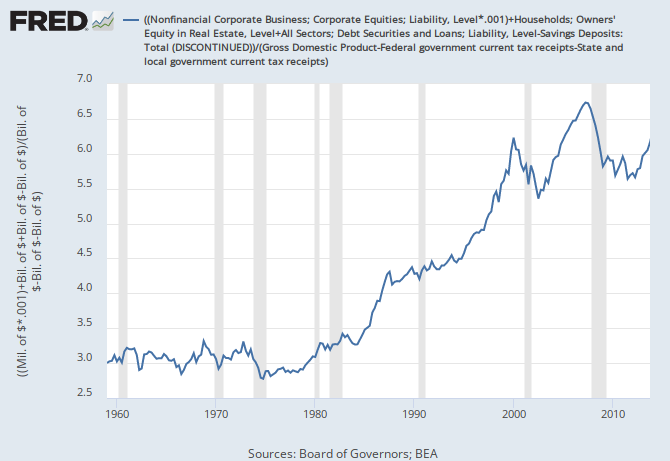 |
| Graph 2 |
No comments:
Post a Comment