Tuesday, April 22, 2014

Gulf Coast Crude Inventory Record

From the EIA:
Crude oil inventories on the U.S. Gulf Coast (USGC) reached 207.2 million barrels (bbl) on April 11, a record high. The elevated inventory levels are the result of the continuing strong crude oil production growth, the opening of TransCanada's Marketlink Pipeline, and a drop in crude oil inputs at USGC refineries as a result of seasonal maintenance.
...
The main driver of the recent crude oil inventory builds on the USGC is start-up of TransCanada's 700,000-bbl-per-day (bbl/d) Marketlink Pipeline, which runs from the Cushing, Oklahoma storage hub to the Houston area. In late January, TransCanada completed the first delivery of crude oil via Marketlink to USGC refineries. Trade press has reported that crude oil deliveries via Marketlink are expected to average 525,000 bbl/d in 2014. The pipeline start-up has been a main driver of recent corresponding draws at Cushing.
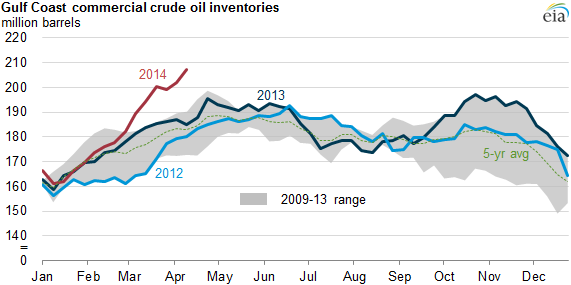
Graph 1

Meanwhile, at Cushing:
Crude oil inventories at Cushing, Oklahoma, the primary crude oil storage location in the United States, decreased 13 million barrels (32%) over the past two months. On March 21, Cushing inventories were less than 29 million barrels, more than 20 million barrels lower than a year ago and the lowest level since early 2012. Cushing is the delivery location for the New York Mercantile Exchange (Nymex) West Texas Intermediate (WTI) crude oil futures contract.
The recent drawdown of stocks at Cushing resulted from three factors:
  • The startup of TransCanada's Cushing Marketlink pipeline, which is now moving crude oil from Cushing to the U.S. Gulf Coast
  • Sustained high crude oil runs at refineries in Petroleum Administration for Defense Districts (PADD) 2 (Midwest) and 3 (Gulf Coast), which are partially supplied from Cushing
  • Expanded pipeline infrastructure and railroad shipments that have made it possible for crude oil to bypass Cushing storage and move directly to refining centers in PADDs 1 (East Coast), 3 (Gulf Coast), and 5 (West Coast)
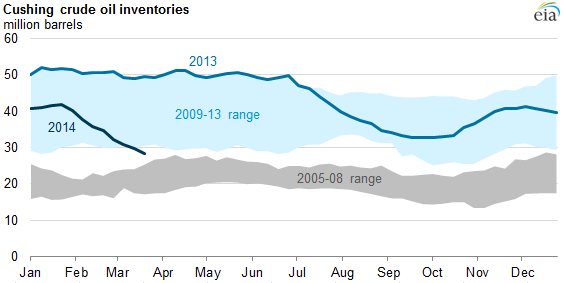
Graph 2

This is leading to a discount in Light Louisiana Sweet (LLS) (the Gulf Coast benchmark) to West Texas Intermediate (WTI) (the US benchmark).  WTI is already trading at a discount to Brent (sort of the world/European benchmark) and the TransCanada pipeline may cause further discount in LLS.
Graph 3

Sunday, April 13, 2014

Another Spectre For Rising Consumer Spending

Delinquency rates on consumer and credit card loans are at 20+ year lows.
Graph 1

Charge-off rates are at 15 and 20 year lows.
Graph 2

Looking at cars, 48-month financing looks like it is supercheap by recent historical comparison, and the inventory to sales ratio is moving upward (suggesting favorable conditions for consumers).  The housing market still looks tight.  This could mean that people (especially young persons and young couples) will look toward car purchases as a way to substitute the American dream.  Also, appears to be a trend in leasing autos.
Graph 3

The market seems to have changed since the recession, and why not?  Fiat acquired Chrysler in the wake of the recession, and Chevrolet required a massive loan from the federal government to prevent liquidation bankruptcy.  These kinds of corrections may have helped correct the flawed thinking of those and other automakers.
Graph 4

Wednesday, April 9, 2014

Value Invest Much?

Two charts I made to capture the EV/EBITDA (Enterprise value to Earnings ratio) of the US stock market and US economy, as closely as possible.

First: The stock market

A = Nonfinancial Corporate Equities
B = Nonfinancial Corporate Debt
C = Nonfinancial Corporate Savings
D = Corporate Profits

(A + B - C) / (D)
-or-
[(Nonfinancial Corporate Equities) + (Nonfinancial Corporate Debt) - (Nonfinancial Corporate Savings)] / [(Corporate Profits)]
Graph 1

Second: The whole US economy

A = Nonfinancial Corporate Equities
B = Homeowner's Equity
C = Total Credit Market Debt
D = Total Saving
E = GDP
F = Federal Taxes
G = State and Local Taxes

(A + B + C - D ) / (E - F - G)
-or-
[(Nonfinancial Corporate Equities) + (Homeowner's Equity) + (Total Credit Market Debt) - (Total Saving)] / [(GDP)-(Federal Taxes)-(State and Local Taxes)]
Graph 2

Now, it would be nice if the data extended further back, and obviously we need some comparisons to their peers.  However, that will have to wait.

Tuesday, April 8, 2014

Is US Consumer Spending About to Take-Off

I decided to look into the matter of housing starts hitting a recent plateau.  What I think stands out most in the following graph is a kind of out-of-phase correlation between household financial obligations and housing starts.  Though certainly the correlation makes sense!
Graph 1
It almost looks as if I could take the red line (housing starts) and shift it over to the right just a little bit, and then the two would line up almost perfectly.  In fact, I loaded the data into Excel, moved the (quarterly) data over by 10 quarters (2.5 years -or- 30 months), and I produced the following graph.
Graph 2
Pretty neat, huh?  Now, is this any sort of indicator of consumer spending?  First, I should let you know that financial obligations refers to mortgages, rent, auto-loans, homeowner's insurance, property tax and that sort of thing.  That should mean that financial obligations follow housing availability trends, as well as auto availability trends.  But should consumer spending follow the trend in mortgage and rent payments?

Why not?  First, why so?  If you believe in the wealth effect - people get a little richer (produce more) and spend a little more (consume more) - then you might say that consumer spending will have some correlation with housing trends.  As people buy houses, they also buy appliances, furniture, cheap plastic stuff, hardwood floors and so on.  Some of these would be examples of durable goods.  I think there is strong correlation between durable goods and housing starts, so let's see the trend.

Durable goods are only part of personal consumption.  I think the housing market is just as fragmented now as it was in 2005-2006 when places like Los Angeles, Las Vegas, Miami, and Phoenix were experiencing phenomenal housing price gains.  The hotspots in today's market, to me, appear to bee Dallas, Houston, San Fransisco and Los Angeles.

Spurred by big investments in the oil and gas industry as well as the "new tech", many of these markets are experiencing price growth much higher than the national average.  It will be interesting how things play out over the coming years since the top brass in the oil industry got together and declared $100 oil to be the new $20 oil.

Sunday, April 6, 2014

Is This Real: Venezuela Government Issues Food Ration Card

Tough times for the South American citizens of Venezuela.  Hit by shortages in toilet paper, foreign currency, and oil production, the Venezuelan government is now expected to issue food rationing cards.  From the Guardian:
The ID card, introduced this week, will limit Venezuelans to once-a-week shopping and will set off an alarm to halt any transaction if a purchaser breaks the rules. The government wants to prevent individual shoppers from "over-buying" in a country hit by acute shortages of basic items including milk, sugar and toilet paper. Critics say it is an admission of failure of economic policy in one of the world's big oil-producing nations. 
"The government needs to control the hoarders. They have made this worse. But if there weren't shortages there wouldn't be hoarders. We are trapped," says Jose Diaz, a 65-year-old construction worker.
The last time the Venezuelan government dealt with hoarding, it seized control of a electronic stores in Caracas and discounted prices to fire sale levels.  So much for being trapped.
According to the food minister, FĂ©lix Osorio, registering for the card will not be mandatory and regular users may still shop at the network of subsidised food chains. But as with many customer loyalty programmes, cardholders will benefit from even lower prices, extra offers and even enter a raffle to win one of 500 houses in Venezuela's largest public housing programme.

Friday, April 4, 2014

Brazil Raises Key Interest Rate

Brazil continues its trend of monetary discipline with another raise in the key Selic interest rate.  From Reuters:
Although another rate hike in May has not been ruled out, the statement signaled that the bank would be very sensitive to upcoming economic and inflation indicators to decide whether to continue raising borrowing costs or end the cycle. 
Many analysts have said the bank could very well end the tightening cycle in May to avoid hampering the growth of an economy that has been stuck in a rut for the last three years. 
... 
Another inflation bout caused by a rise in food prices as a severe drought hit crops in southeastern Brazil has threatened to push inflation above the ceiling of the official target range of between 2.5 and 6.5 percent.