How long would it take for GDP to equal TCMDO in the same year (assuming certain GDP growth rates)?
 |
The data is arranged such that as of now it will take 126.6 years for GDP to equal current TCMDO at 1% GDP growth; 63.6 years at 2%; 42.6 years at 3%; 32.1 years at 4%.
|
It will take 126.6 years for GDP to equal the current level of total debt. That's not to say it will take 126.6 years to pay off the total debt.
The next graph is a breakdown of total debt into private debt and associated government debt (federal, state and local, GSE and Agency associated debt). The denominators are GDP; GDP-GRECPT (disposable GDP); GRECPT (taxes).
The next graph is a breakdown of total debt into private debt and associated government debt (federal, state and local, GSE and Agency associated debt). The denominators are GDP; GDP-GRECPT (disposable GDP); GRECPT (taxes).
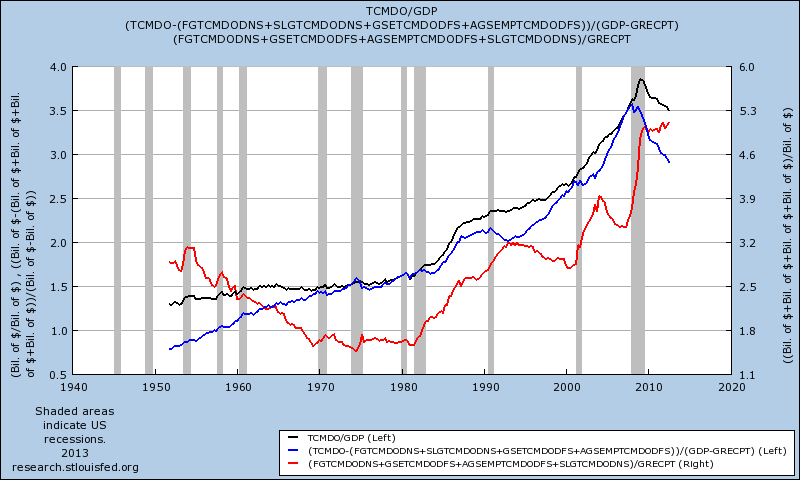 |
Total debt (black; LHS); private debt (blue; LHS); public debt (red; RHS)
|
First graph = disturbing.
ReplyDeleteI had in mind to write a post that never got written, yet, rather the opposite of your first graph here:
The Federal budget was balanced circa 1994-2001 (I forget the exact dates). The deficit went down quickly then. I think a quick paydown is possible.
Debt adds up quickly because all prior year debt still counts in the total... and because to offset the economic drag from that existing debt, the new use of credit must be exceedingly large. So, the addition to existing debt is exceedingly large. Vicious circle.
Anyway, no matter how fast GDP grows, TCMDO will likely grow faster and GDP will never catch up. Never, until we decide to abandon our policies that rely on credit expansion to support growth.
I look at the data in the graphs as products of modern finance: compound interest, leverage, derivatives and arbitrage. Though, not one of these concepts is relatively new; I think demographics might explain certain trends in debt to income ratios.
DeleteOne word I hear quite a bit from Ben Bernanke is 'accomodation'. I think he has it right - the Fed accomodates credit for the people within the US economy.