FRED added some new data sets to its employment series - employment levels by age range. Let's take a look.
The Journey So Far
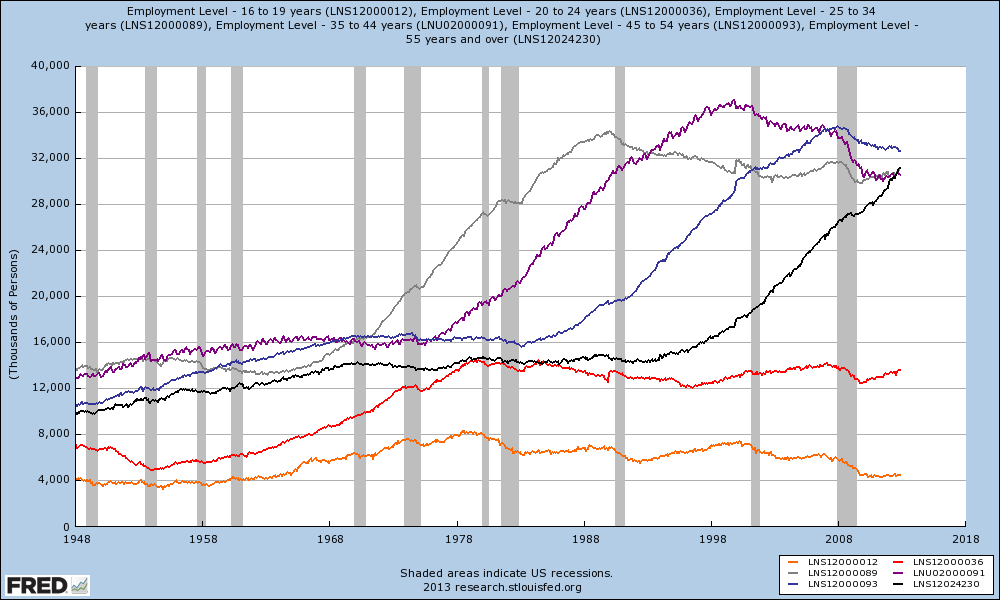
Employment level by age range.
 |
Graph #1: Employment Levels by Age - 55+ (black); 45-54 (blue); 35-44 (purple); 25-34 (gray); 20-24 (red); 16-19 (orange).
|
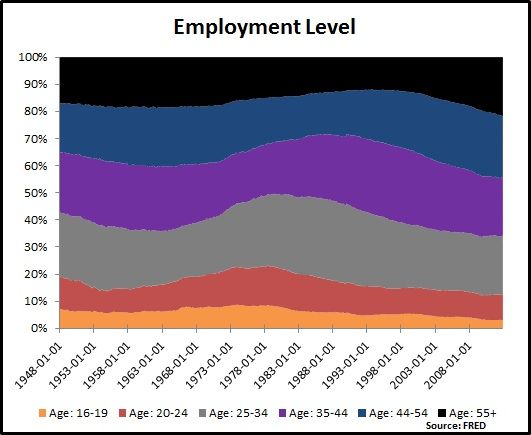
100% stacked graph showing the overall contribution to employment by age range.
 |
Graph #2: Employment Levels by Age - 55+ (black); 45-54 (blue); 35-44 (purple); 25-34 (gray); 20-24 (red); 16-19 (orange).
|
Apparent Trends
It could be me but, in the first graph, I thought I saw a trend. So, below is a table with data for what I identify as pivots (a significant increase in employment level) and peaks.
It could be me but, in the first graph, I thought I saw a trend. So, below is a table with data for what I identify as pivots (a significant increase in employment level) and peaks.
Look at the trends in the 'pivot to peak' and 'peak to peak'. 55+ employment should peak somewhere between Oct-14 and Jan-18. Averaging between the two roughly brings about a date of June-15, which is when I suspect short-term interest rates (Fed Funds) will begin their first significant increase since the beginning of quantitative easing.
The Draw Down
I do not know when the 55+ employment level will peak so soon. I do think fiscal policy could affect the peak date. For instance, if the Medicare eligibility age were changed, or the Social Security eligibility age changed. The 55+ range is technically open ended but the consensus is that people begin to retire around 60-65; this could change based on economic perception and fiscal policy.
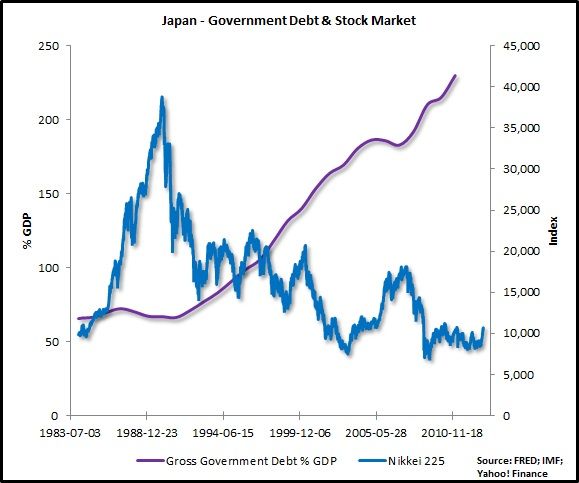
But, as the boomers retire, they will drawdown their pensions. This should drive down stock prices and drive up bond prices (drive down interest rates); the need for boomers to maintain pension reserves could force the federal government to increase its debt level. I think this is similar to what happened in Japan, in which the government debt to GDP ratio has taken off to over 200% since the collapse of a very large late-1980s housing and stock market bubble.
When the boomers draw down their pensions/mutual funds, they will likely be drawing out of equities first. The logical shift is from equities to bonds (the safer bet). I think this would apply to all investors, both small and large, individual and institutional.
That logic challenges the alleged bond (p.14) bubble some people say we are in (or not). Enough of what I think, Harry Dent says that we are about to hit the demographic cliff:
But, as the boomers retire, they will drawdown their pensions. This should drive down stock prices and drive up bond prices (drive down interest rates); the need for boomers to maintain pension reserves could force the federal government to increase its debt level. I think this is similar to what happened in Japan, in which the government debt to GDP ratio has taken off to over 200% since the collapse of a very large late-1980s housing and stock market bubble.
 |
Graph #3: Japan - Gross government debt as percent GDP (purple); Nikkei 225 (blue)
|
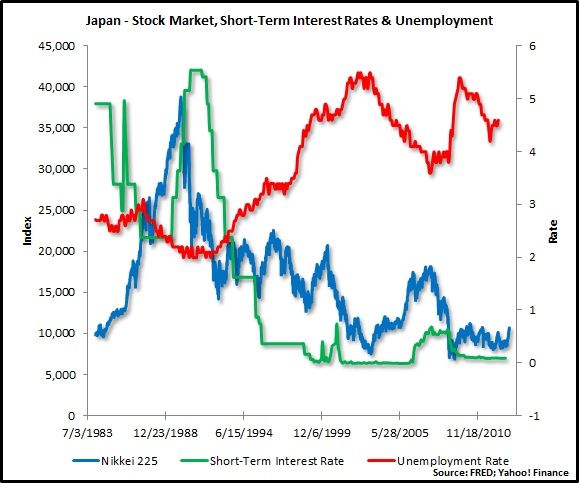
When the boomers draw down their pensions/mutual funds, they will likely be drawing out of equities first. The logical shift is from equities to bonds (the safer bet). I think this would apply to all investors, both small and large, individual and institutional.
 |
Graph #4: Japan - Nikkei 225 (blue); short-term government debt interest rate (green); unemployment (red)
|
That logic challenges the alleged bond (p.14) bubble some people say we are in (or not). Enough of what I think, Harry Dent says that we are about to hit the demographic cliff:
How many crashes have we seen in the last ten years or so? 2000, 2002 – bubble, crash. 2007 – bubble, crash. We're getting a bubble and crash every four or five years.
This is what we have when you go over a demographic cliff. Remember Japan – Japan went over the demographic cliff. Peak in baby boom spending, peak real estate boom.
They had a bust. Guess what? 22 years later, real estate is still down over 60 percent, still drifting down. Stocks are down nearly 80 percent, not that far off their lows. They keep bubbling up and then going down to new lows.
This is the new normal, given that baby boomers are aging and the next generation is not only not in the workforce yet, largely, but they're not as large when they do [enter]. So, we're never going to see real estate prices at these levels again, and we're not going to see stocks at the level we saw in 2007 for a long time.

No comments:
Post a Comment