Initial claims are flattening out around 340,000. Although claims have been trending downward since the end of the recession, they had previously flattened out for much of 2012. It kind of goes against the unemployment rate trend -- moving downward, currently at 7.0%.
 |
| Past 5-years: 4-week moving average (blue; left) and weekly (red; left) unemployment claims, and the unemployment rate (black; right). |
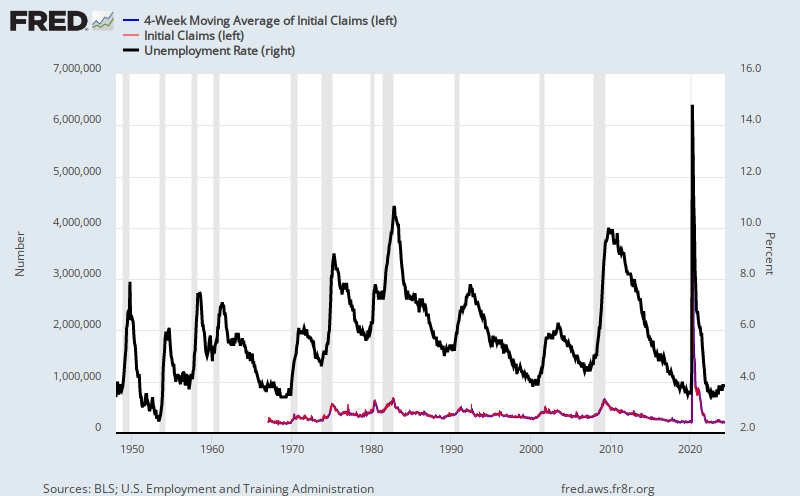
It kind of goes against the historical data which show correlation between initial claims and the unemployment rate; however, the unemployment data lag the initial claims data. There are also periods where initial claims quickly shot upward with no such correlation in the unemployment rate (i.e. late-2005, late-2012). Of course, that is long-term correlation on a decades-wide scale -- the above chart points to a narrower range of about a half-year.
 |
| Since 1967: 4-week moving average (blue; left) and weekly (red; left) unemployment claims, and the unemployment rate (black; right). |


Many part time jobs and temp jobs will not qualify for UE when the job ends.
ReplyDelete