Wednesday, April 10, 2013

Chinese Trade Balance

$880 million trade deficit posted by China, surge in imports cited for cause along with ever present skepticism over data integrity.  2012 estimated exports and imports for China were $2.05 trillion and $1.817 trillion, respectively, according to the CIA World Factbook.  From Market Watch:

LOS ANGELES (MarketWatch) — China swung to a trade deficit of $880 million in March, the General Administration of Customs reported Wednesday, as imports surged 14.1% from a year earlier. 

The deficit, which followed February’s $15.3 billion surplus, missed a forecast for a surplus of $14.7 billion from a Dow Jones Newswires survey and a $15.2 billion projected surplus tipped by Bloomberg News. 

The gain in imports, which fell more than 15% in February, exceeded a 6.1% growth forecast from Dow Jones Newswires and a 5.2% estimate from a Reuters survey. 

Exports rose 10% from March 2012, less than Dow Jones’ expected increase of 12% and well below an almost 22% rise in February.
... 
“Whilst total export growth of 10% year-on-year in March is far more reasonable a number than in January and February, the breakdown of exports by destination veers towards the absurd,” wrote IHS economists Xianfang Ren and Alistair Thornton. 

They cited the data’s 93% surge in exports to Hong Kong, coupled by a 14% drop in Europe-bound shipments and a 7% fall in those to the U.S. 

Given a lot of exports to Hong Kong are actually re-exported to the E.U. and U.S. as final destinations, this seems a little incongruous, to say the least,” they wrote. 

They offered “guesses” as to reasons behind the alleged inaccuracies, including capital inflows disguised as exports, fake orders meant to secure government export-tax rebates, and political pressure to goose the data. 

Tuesday, April 9, 2013

Income: Wage and Salary vs Dividend and Interest

First chart, income indices.
Indices of wage and salary compensation (black), dividend income (green), and interest income (orange).
Second chart, rentier income percent of personal income.
Dividend income plus interest income as a percent of personal income.

Monday, April 8, 2013

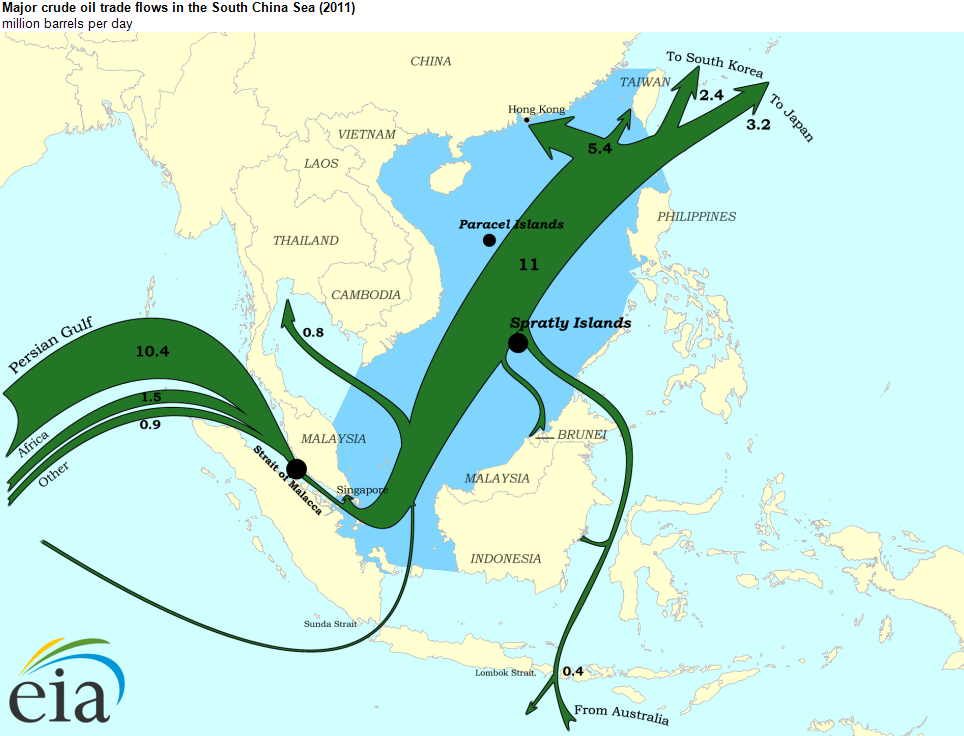
South China Sea: Oil and Gas Transportation

Interesting article at the Energy Information Administration (EIA).
EIA estimates that by the end of 2011, trade through Malacca was greater than 15 million bbl/d, or about one-third of all seaborne oil. In comparison, the world's most important chokepoint for maritime transit, the Strait of Hormuz between the Persian Gulf and Arabian Sea, had an oil flow of about 17 million bbl/d in 2011 (see World Oil Transit Chokepoints). Average daily oil consumption worldwide in 2011 was about 88.3 million bbl/d.

Sunday, April 7, 2013

FedEx Lowers Asian Economy Forecast

FedEx, major worldwide transporter, has lowered its forecast for the rest of the year, due particularly to Asian economies. 

FedEx said the express unit had underperformed largely due to weakness in Asia and other international markets, where margin pressures caused by excess capacity in the air freight industry had more than offset increased volumes.

Saturday, April 6, 2013

Credit Market Assets: The Flip Side of Credit Market Debt

Who owns what is owed, and why?  In the following charts: blue = financial sectors; red = nonfinancial sectors; green = foreign sectors.
Credit market assets held by domestic financial sectors (blue), domestic nonfinancial sectors (red) and foreign sectors (green).
Because the financial sectors lend money, they hold debt (and sell it).  Nonfinancial sectors, which include commercial businesses and households, are the two largest net debtors. The green line? Trade policy.

Credit market assets are the asset side of debt.
Debt minus assets.
Assets to debt.
Assets divided by debt for domestic financial sectors (blue), domestic nonfiancial sectors (red) and foreign sectors (green).
Close up.
Close up - since 1971.  Assets divided by debt for domestic financial sectors (blue), domestic nonfiancial sectors (red) and foreign sectors (green).

Assets minus debt.
Assets minus debt for domestic financial sectors (blue), domestic nonfiancial sectors (red) and foreign sectors (green).

Friday, April 5, 2013

M1 Multiplier: Addendum

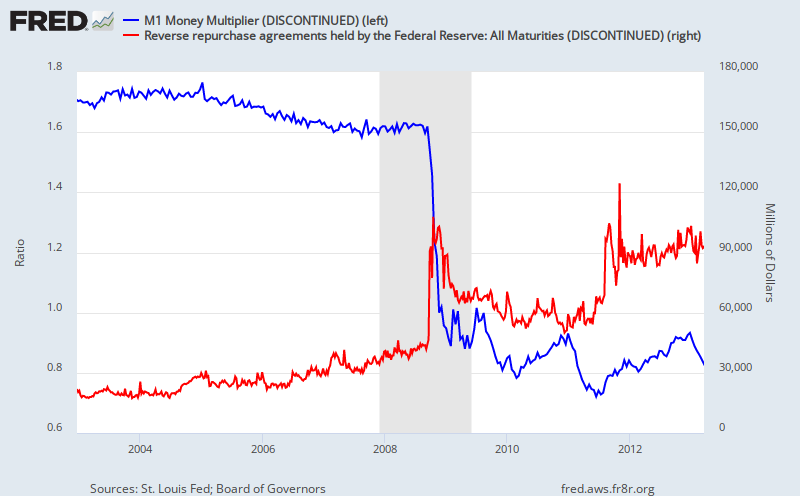
Got ahead of myself, here is another graph.
M1 Multiplier (blue; left-side) and Federal Reserve Repoing (red; right-side).

M1 Multiplier

And those reverse repos.
M1 Multiplier (left) and Fed Reverse Repoing (right).