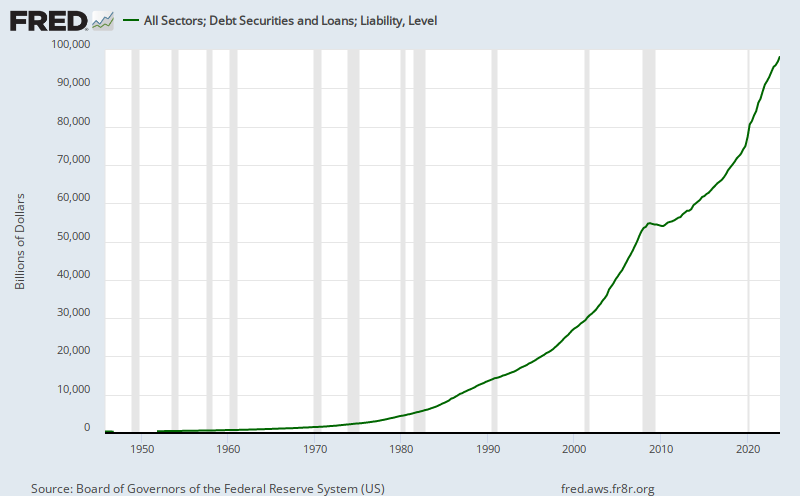
The total debt (credit instrument liability) of the US (public and private) now stands at $56.999 trillion.
 |
| Total debt of the United States. |
I always liked this graph.
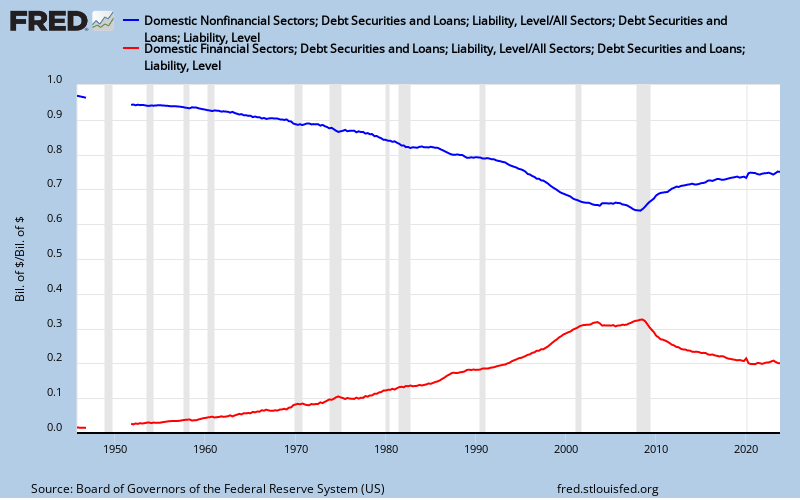 |
| Non-financial debt as percent of total (blue); financial debt as percent of total (red). They do not add to 1 (100%). |
Here is what is missing from the above chart.
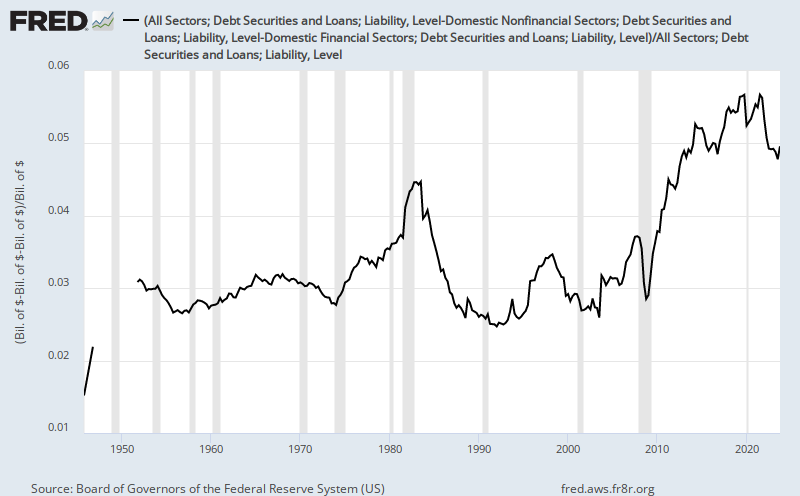 |
| Non-financial and non-non-financial (?) debt as percent of total. |
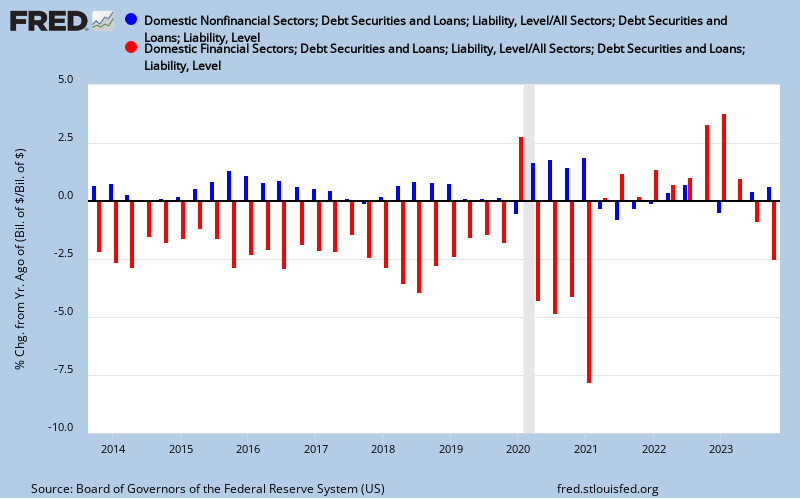
Similar to the second graph, but just the year-over-year (YOY) change in the two percentages.
 |
| YOY change in non-financial (blue) and financial (red) debt each as percent of total. |
Here's what's missing from the second chart:
ReplyDeletehttp://research.stlouisfed.org/fred2/graph/?g=kCJ
"Rest of the World; Credit Market Instruments; Liability (DODFFSWCMI)"
Nice work noticing the discrepancy.
//
It's like an in-joke, the title of your post. I like it.