 |
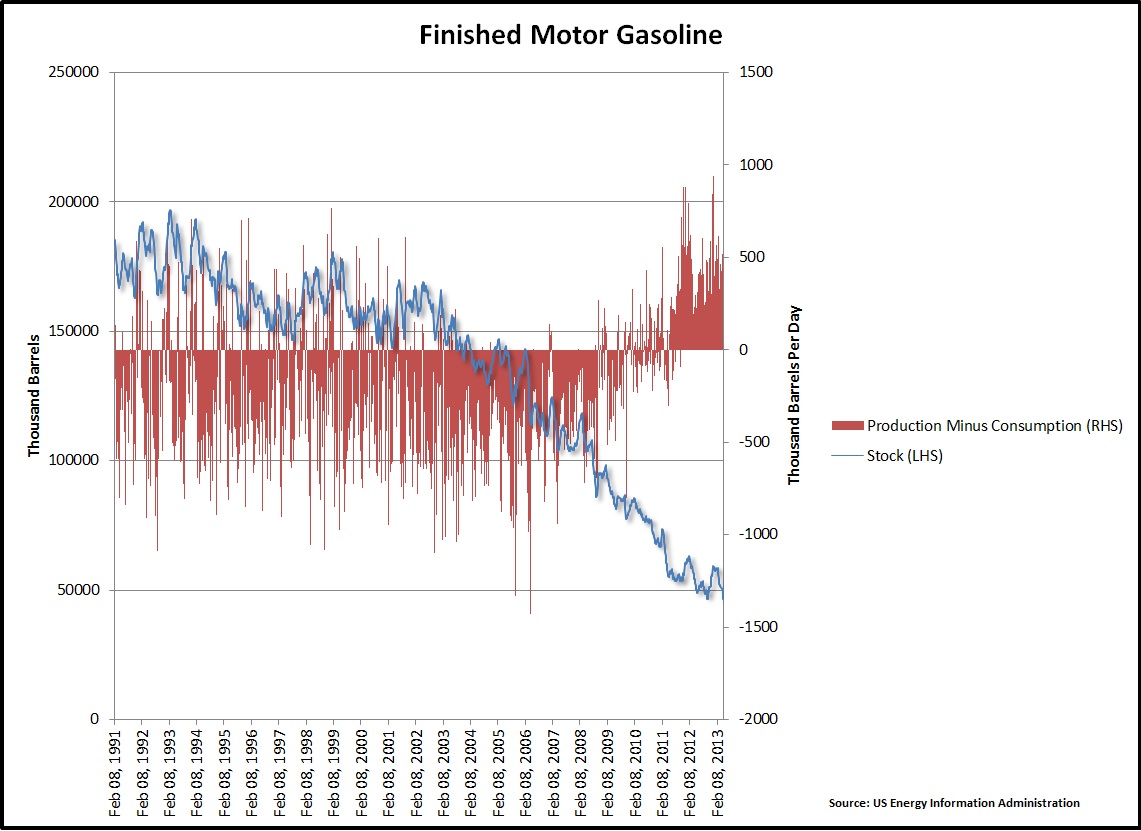
| Gasoline stock (blue; left) and production minus consumption (red; right). |
Monday, May 13, 2013
Finished Motor Gasoline Stock
How much lower can the stock of US gasoline get?

Saturday, May 11, 2013
Chinese Cotton Stockpiles
For the past three years, China has been turning to the U.S. for millions of bales of cotton. But instead of consuming that cotton and keeping the demand high, the Chinese have been storing it, gradually building its stock up to to more than 60 percent of the world's inventory.
This news could explain the chart in a previous post of mine. Also, this news goes along with the "Chinese are hoarding commodities" theme circulating the media, as seen here for example.
Another amusing, semi-related series at FRED:
Another amusing, semi-related series at FRED:
 |
| Personal Consumption: Nondurable Goods: Female clothing (blue; left), male clothing (red; left), and the female to male ratio (green; right). |
Thursday, May 9, 2013
Housing Charts
If my city (Houston) is any indication of the current state of the housing market - it is looking good (on the outside). I caught this post at Dr. Housing Bubble and thought it would be worthwhile to look at a couple charts.
 |
| Household real-estate assets to disposable income (blue; left) and housing starts (red: right). |
 |
| Real-estate loans to owner's equity (blue; left) and average house sales price (red; right). |
Starts and prices appear to have rebounded. It may seem that the low-inventory fueled price rebound has worn thin - until shadow inventory is factored in. What exactly would a bank do with newly built foreclosed houses on its book versus older houses?
If it were up to me - I would rent the newer houses and demolish the older houses (to build new units). How then would anyone be able to afford an assumed more expensive newer house? Credit.
We are indeed seeing greater mortgage application and refinance activity, and maybe soon we will see a rebound in mortgage amounts.
 |
| Mortgage debt (blue; left) and year-over-year change in mortgage debt (red; right). |
Monday, May 6, 2013
Household Debt Payments: Percent of GDP
This is great. I have taken the household debt payment (TDSP) and financial obligations series (FODSP), which measure payments as a percent of disposable income, and I have divided them by gross domestic product (GDP). Household debt payments are currently 8% of GDP and were 10.5% of GDP at the height of the financial crisis.
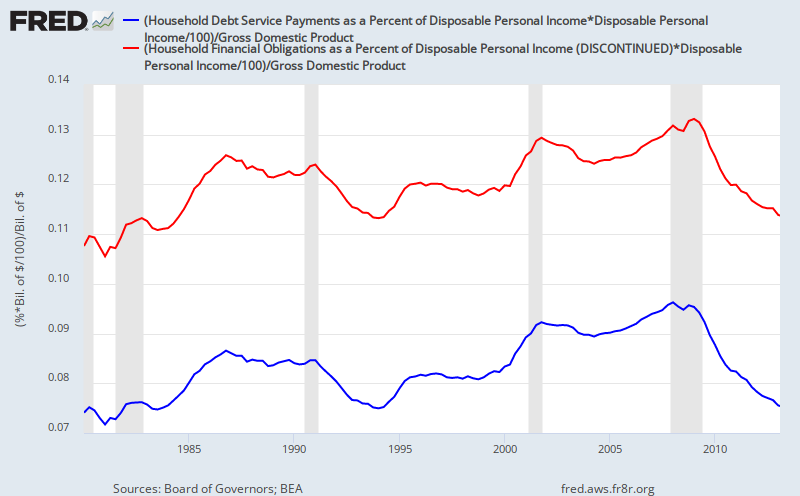 |
| Household debt payments (TDSP) and household financial obligations (FODSP) each multiplied by disposable personal income, and then divided by GDP. |
 |
| Household debt payments (TDSP) to financial obligations (FODSP). |
 |
| Debt payments and tax payments as percent of personal income. |
Sunday, May 5, 2013
Credit Market Debt - Private Nonfinancial Sectors
The following chart shows the private nonfinancial sectors' debt as percent of private debt (less government debt). The nonfinancial corporate sector's debt-share amongst the various private sectors has increased since the recession - perhaps reflected in part by an increase in (low-yielding?) junk bonds.
 |
| Households (blue), nonfinancial corporate business (red), nonfinancial noncorporate business (green) and farm business (orange). |
Friday, May 3, 2013
Eurozone Update
PIIGS Unemployment
Eurozone production index - construction sector.
 |
| PIIGS Unemployment rate. |
 |
| Production index in the construction sector. |
Thursday, May 2, 2013
Top 50 Holding Companies (Banks) By Assets
Actually the Top 49 - data appears to be missing for the last name on the list, lol. JPMorgan and Bank of America together make up 30% of the Top 49; add in Citi, Wells Fargo and Goldman and it is 57% of the Top 49. From the Federal Financial Institutions Examination Council.
 |
| Top 49 bank holding companies by total assets. |
Subscribe to:
Posts (Atom)