Thursday, April 4, 2013

David Stockman: Venting

I came across David Stockman's New York Times opinionated editorial via Paul Krugman's putdown.  I think Stockman makes some interesting observations and at times is way too dogmatic (and political), but it is very entertaining.  This gem caught my eye:
 
That Mr. Greenspan’s loose monetary policies didn’t set off inflation was only because domestic prices for goods and labor were crushed by the huge flow of imports from the factories of Asia. By offshoring America’s tradable-goods sector, the Fed kept the Consumer Price Index contained, but also permitted the excess liquidity to foster a roaring inflation in financial assets. Mr. Greenspan’s pandering incited the greatest equity boom in history, with the stock market rising fivefold between the 1987 crash and the 2000 dot-com bust.
 
Certainly there was inflation during Greenspan's time running the US Federal Reserve, but I agree that there is a wealth effect associated with cheap imports.  No doubt that when measured to expectations of price inflation, cheap imports reduce the household budget enough to make it appear that the household has become wealthier.  This may be one explanation for rising debt levels, as well as demographic changes (i.e. baby boomers).
 
One more gem:
 
Instead of moderation, what’s at hand is a Great Deformation, arising from a rogue central bank that has abetted the Wall Street casino, crucified savers on a cross of zero interest rates and fueled a global commodity bubble that erodes Main Street living standards through rising food and energy prices — a form of inflation that the Fed fecklessly disregards in calculating inflation.
 
He is entertaining with an interesting view on the repo (rental) market.


Total Debt and Gross Savings

Fractional reserve leveraging.
Total debt divided by gross savings.

MZM

Zero interest money.

1. Minus the personal savings.
Zero interest money minus personal savings.
MZM compared to M1 and M2...and M3.
MZM divided by M1 (blue), M2 (red), and M3 (green).
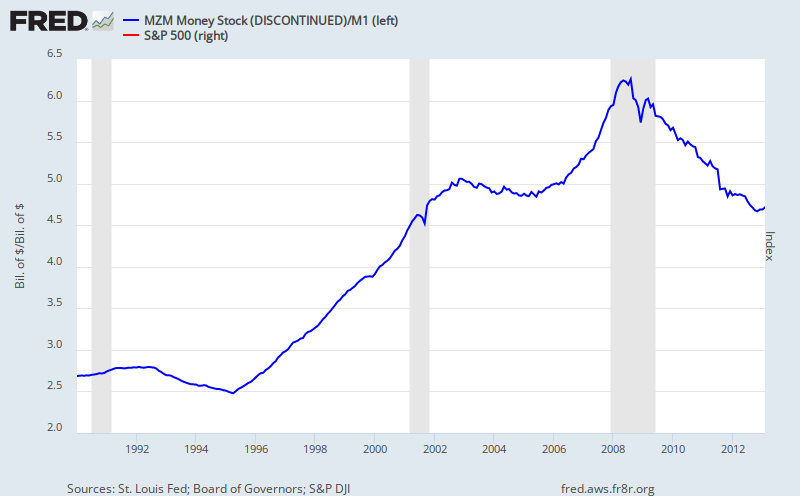
2. MZM/M1 from 1990 to present, included S&P 500 Index.
MZM/M1 (blue); S&P 500 Index (red).
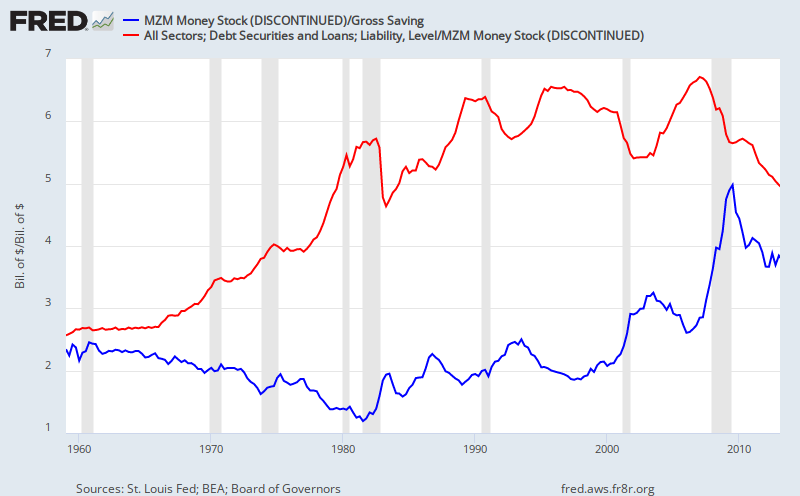
3. MZM divided by total debt, and gross savings.
MZM divided by gross savings (blue); total debt divided by MZM (red).

Wednesday, April 3, 2013

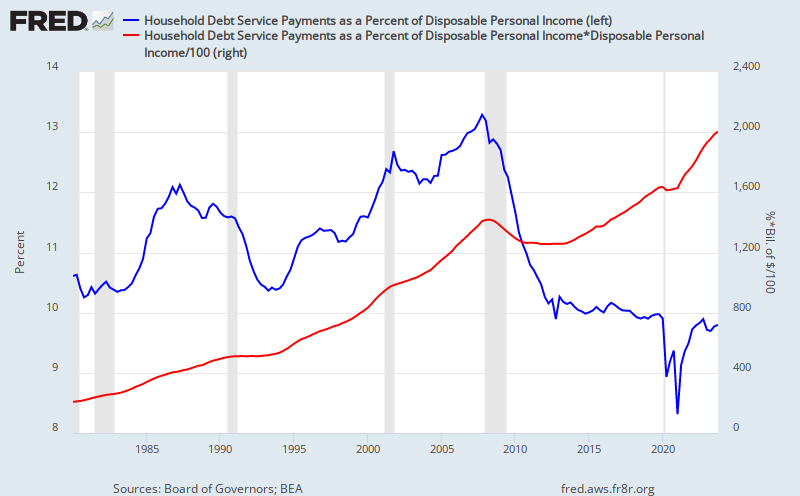
Household Debt Service Payments

This looks like an interesting data series.  I wonder how well household payments mimic non-household payments.

Household debt payments as percent disposable income (blue); household debt payment (red).

Money Funds

Interesting.
Retail money funds (WRMFSL) plus institutional money funds (WIMFSL).
From CNBC:
But for contrarians, retail investors' return to stocks raises a red flag that the markets-which have recouped their losses since the banking crisis-could be close to the end of their rally. This view stems from the unfortunate trend of retail investors who are notorious for "buying high and selling low."
 
Oh, I see. And the institutional investors? 

Tuesday, April 2, 2013

Stamp Act

Money changers?  From wikipedia:

Like previous taxes, the stamp tax had to be paid in valid British currency, not in colonial paper money.
Taxation within taxation.

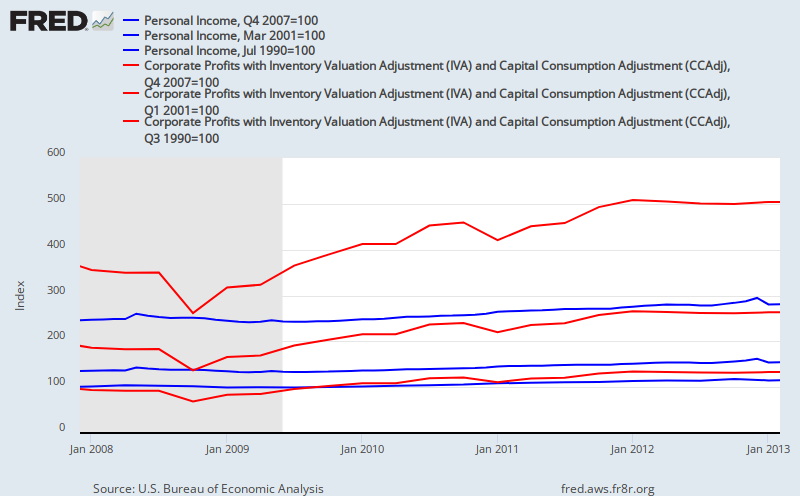
Personal Income and Corporate Profits

Maybe this is too simple an analysis.
Personal income (PI) divided by pre-tax corporate profits (CPROFIT).
Perhaps a step in the right direction.
Personal income (blue lines) and pre-tax corporate profits (red lines) indexed to the beginning of each of the most recent three recessions.
Personal income (blue lines) and pre-tax corporate profits (red lines) indexed to the beginning of three recessions before the three recessions mentioned above.